College LoansPaying off a $20,000 loan with an interest rate of 5% and monthly payments of $100 would take around 35 years. This loan would actually end up costing around $22,393.76. That's almost $2,500 just in interest.
This same loan and interest rate with a $50 monthly plan actually wouldn't work at all. $50 a month is just enough to pay off a little interest and none of the actual loan. The amount of money will just increase exponentially for eternity. Paying off this loan with a $150 monthly payment would be more reasonable than $100 and $50, it would only take around 15 and half years. Federal subsidized and unsubsidized loans for an undergraduate student both have interest rates of 4.45%. It's very surprising to me just how long it takes to pay off $20,000. It's also very interesting how much of an impact 50 more dollars a month would make- in this situation, 20 years.
0 Comments
Zeros are the solution to functions. When written in relation to x, or the equations they were derived from (example (x-1)), they become factors. These factors all together multiply out to create the original function. Division is important in this process because it gives the phrases that were multiplied out to make the function- in other words, the factors. The degree of the polynomial represents how many zeros it will have. This does not in fact say how many factors a function will have, mainly because of repeating factors.
Even and Odd Functions ActivityEven and odd functions share key similarities and big differences. They are both symmetric in different ways, even functions having y-axis symmetry and odd functions having origin symmetry.
Checking to see if a function is even or odd is a simple process. Plug (-x) into the equation. If you get the exact same thing you started with, the function is even. If you get the exact opposite of the function you started with, the function is odd. Functions that are neither even nor odd I'm assuming don't have either of the described symmetries. If I had a question it would be on that.  My graphs were similar in shape to the actual graphs. The only differentiating factor was the size, which only occurred because I did not expect the skateboard to travel so far. The 21 inch ramp definitely had the highest maximum, which means it sent the skateboard the furthest. This was followed, predictably in order, by the 14 inch and 7 inch ramps.
The zeros of these graphs stand for when the skateboard was not moving. The skateboard could take longer or shorter to reach zero again based on the momentum each ramp gave it. The slope of the graph represents the rate at which the skateboard is traveling. Obviously, the steepest points of the parabolas were at the beginning, when the skateboard had the most momentum off of the ramp. The slopes fell fastest right after the maximum, and this was because gravity was pulling it down the second ramp: the driveway. 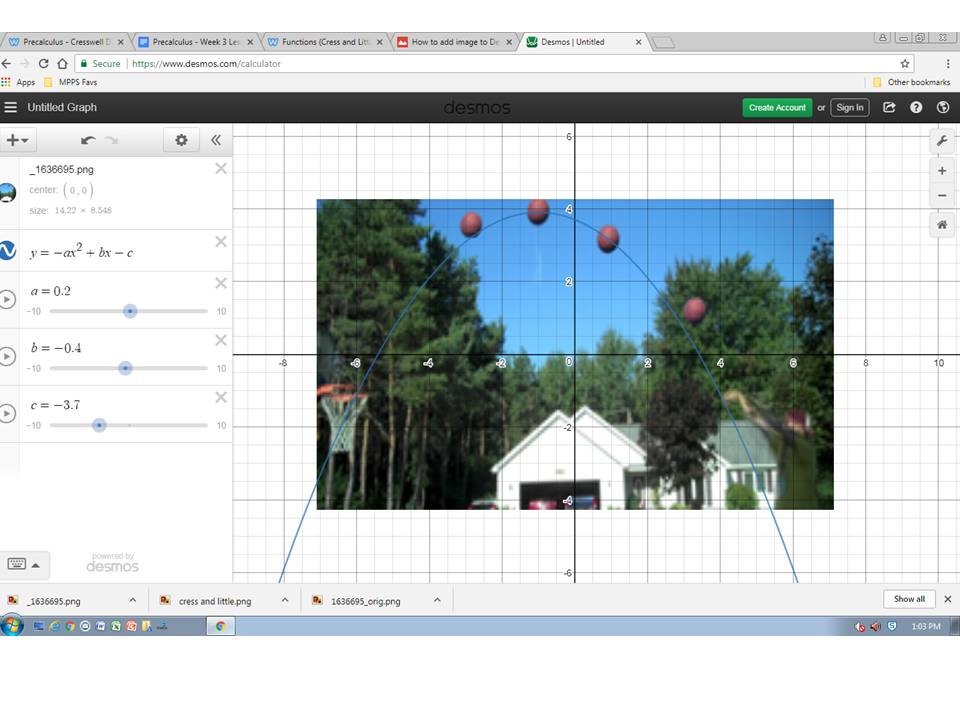 From the angle of the parabola it seems that Cresswell's basketball skills will pull through
Graph A states that the height of the flag is equal with the time it takes to raise it. For example, if the flag pole is 5 feet high, it will take 5 minutes for the scout to raise it. Graph B means that the flag is very easy and quick to raise while it is short, but as it gets longer it will take more time. Graph C states that flag poles that are within a couple feet of each other will take the same amount of time to raise, or that the scout has to stop every couple of feet and readjust. Graph D is basically the opposite of Graph B- the shorter the flag is, the longer it takes to raise it. Graph E states that if the flag pole is short or long, it takes a disproportionately long time to raise, but average size flag poles take all around the same, appropriate amount of time. Graph F is extremely unrealistic as it shows that the flag takes exactly the same amount of time to raise no matter how tall or short it is. Graph A is obviously the most realistic- the taller the flag, the longer the time, the shorter the flag, the shorter the time.
|
AuthorWrite something about yourself. No need to be fancy, just an overview. Archives
November 2017
Categories |
 RSS Feed
